A typical B2B SaaS MQL to SQL conversion rate sits at roughly 13% to 15%, and the historical cross-industry average is about 13%. The arithmetic is one line: SQLs divided by MQLs, multiplied by 100, counted over a fixed period.
That headline has moved. DigitalApplied's 2026 lead generation statistics put the median MQL to SQL rate at 9.8%, down from 13.0% in 2024, a swing large enough to make any single benchmark feel shaky when you're staring at your own dashboard.
The reason is definitional. Two companies can run similar funnels, produce a similar number of accepted opportunities, and still report rates miles apart, because one counts a whitepaper download as an MQL while the other requires a pricing-page visit plus a matching job title. The percentage isn't a verdict on demand generation. It's a verdict on your rules.
Get the rules right and the number becomes comparable: to your own past quarters, to one specific channel, and to a published range that measured the same thing you did.
Headline MQL to SQL Benchmarks at a Glance
Blended MQL to SQL conversion rates sit between about 9.8% and 30% in published samples. The spread below is the one worth keeping to hand.
| Benchmark | Rate | How to read it |
|---|---|---|
| Cross-industry historical average | about 13% | Baseline for comparison |
| B2B SaaS median, 2019–2025 client data | 13–15% | Typical range for SaaS teams |
| Top-quartile organisations | 20–30% | Strong performance benchmark |
| Weaker performers | 5–8% | Signal to investigate the handoff |
| 2026 median (DigitalApplied) | 9.8%, down from 13.0% in 2024 | Recent figure, definitions differ across sources |
The first four rows come from a benchmark summary of MQL to SQL conversion statistics drawing on client data collected between 2019 and 2025. Read them in order. The 13% row shows what a broad sample looks like. 13% to 15% narrows that to B2B SaaS. 20–30% marks the strong end, and 5–8% marks the band where the handoff itself is usually the problem rather than the market.
Small movements matter more than they look. Moving from a 13% rate to a 20% rate produces about 54% more SQLs from the same MQL volume, according to the same summary.
Every row is a comparison point, not a target. One company's MQL is a form fill plus a behavioural score. Another's is matched firmographics alone. An SQL usually requires sales acceptance or evidence of an active buying conversation, and those acceptance rules vary by sector, deal size and buying cycle.
Place your own rate in one of four positions: below the weaker band, inside the typical range, in the top quartile, or unknown because nobody has written the definitions down. The last is the most common.
Define MQL and SQL Before You Measure
An MQL is a lead that has met marketing's fit or engagement rule. That might be a demo request, a content download from someone whose job title matches the profile, or a behavioural score crossing a set level. An SQL is a lead sales has accepted as worth working, usually after verified fit and some evidence of a buying situation.
Both are judgement calls, which is why they need writing down before any rate means anything. 38% of surveyed organisations did not track the stage at all, according to a 2025 study summarised in ClickMinded's B2B marketing benchmarks. An untracked stage can't be improved, only argued about.
Seven items belong in the written handoff:
- Firmographic fit. Company size, sector and region, so sales knows the account can buy. Without it, the rate measures list quality rather than qualification.
- A recorded problem or trigger, including its type. A relevant vacancy, a technology change, a stated business problem. An isolated engagement signal doesn't establish purchase intent, so it belongs on the record as a trigger, not as proof of need.
- Buying role. Decision-maker, champion, influencer or user. A perfect-fit lead in the wrong role converts at zero and drags the rate down.
- The engagement threshold. Say plainly how much activity makes an MQL. Otherwise marketing and sales each apply a private bar and the argument never resolves.
- An owner and a response-time target. One named person and one number of hours. Slow first contact reappears later as a rejection reason, and the rate takes the blame.
- A fixed rejection list. No budget, wrong role, unreachable, no trigger, competitor, existing contract. Free-text reasons can't be counted.
- The conversion window. Thirty, sixty or ninety days. Leave it out and SQLs from last quarter's leads get counted against this quarter's MQLs.
Put all seven in one document both teams can open, agree it with sales leadership, and review it each quarter. The lead qualification criteria worth pressure-testing first shows how to test each rule against real closed-won and closed-lost records.
A rate without a written definition isn't a measurement. It's an opinion with a percentage sign.
Set Up CRM Fields to Measure the Rate
The rate is only as good as the fields behind it. Most CRMs and marketing automation tools can hold each of the following as a lead or contact property, with a timestamp for every lifecycle change.
- MQL date. The day the lead crossed marketing's rule. Written by the system, not typed by a person.
- SQL date. The day sales accepted it. Sales sets this field and nobody else edits it.
- Rejection reason. Picked from the fixed list, never typed freehand.
- Source and campaign ID. Written when the record is created. Edits made later overwrite history and break every comparison that follows.
- ICP segment and trigger type. Two short fields that let you split the rate next quarter without re-reading old call notes.
- Opportunity created date. Linked back to the lead, so pipeline can be traced to the MQL that started it.
Two rules keep the data honest. An SQL date can never fall before its MQL date, and a lead sent back to nurture keeps its history rather than being replaced by a fresh record.
Export the data monthly and check for missing sources, duplicate contacts and dates in the wrong order before calculating anything. Stage names differ between platforms, so record the exact field name each team uses inside the shared definitions document. Sales Montana's conversion documentation is a useful reference for how stage records and conversion events are structured when your own vendor's help centre is thin.
This stage is also where teams discover the CRM is the constraint, which is the case made in why a CRM system matters more than the tool you choose.
How to Calculate Your MQL to SQL Rate
Divide the SQLs attributed to MQLs by the total MQLs, multiply by 100, and measure both counts over the same period. That's the whole formula. Docket's guide to the MQL to SQL conversion rate makes the point that the figure is only meaningful once both stages are defined precisely, which is why the definitions come first.
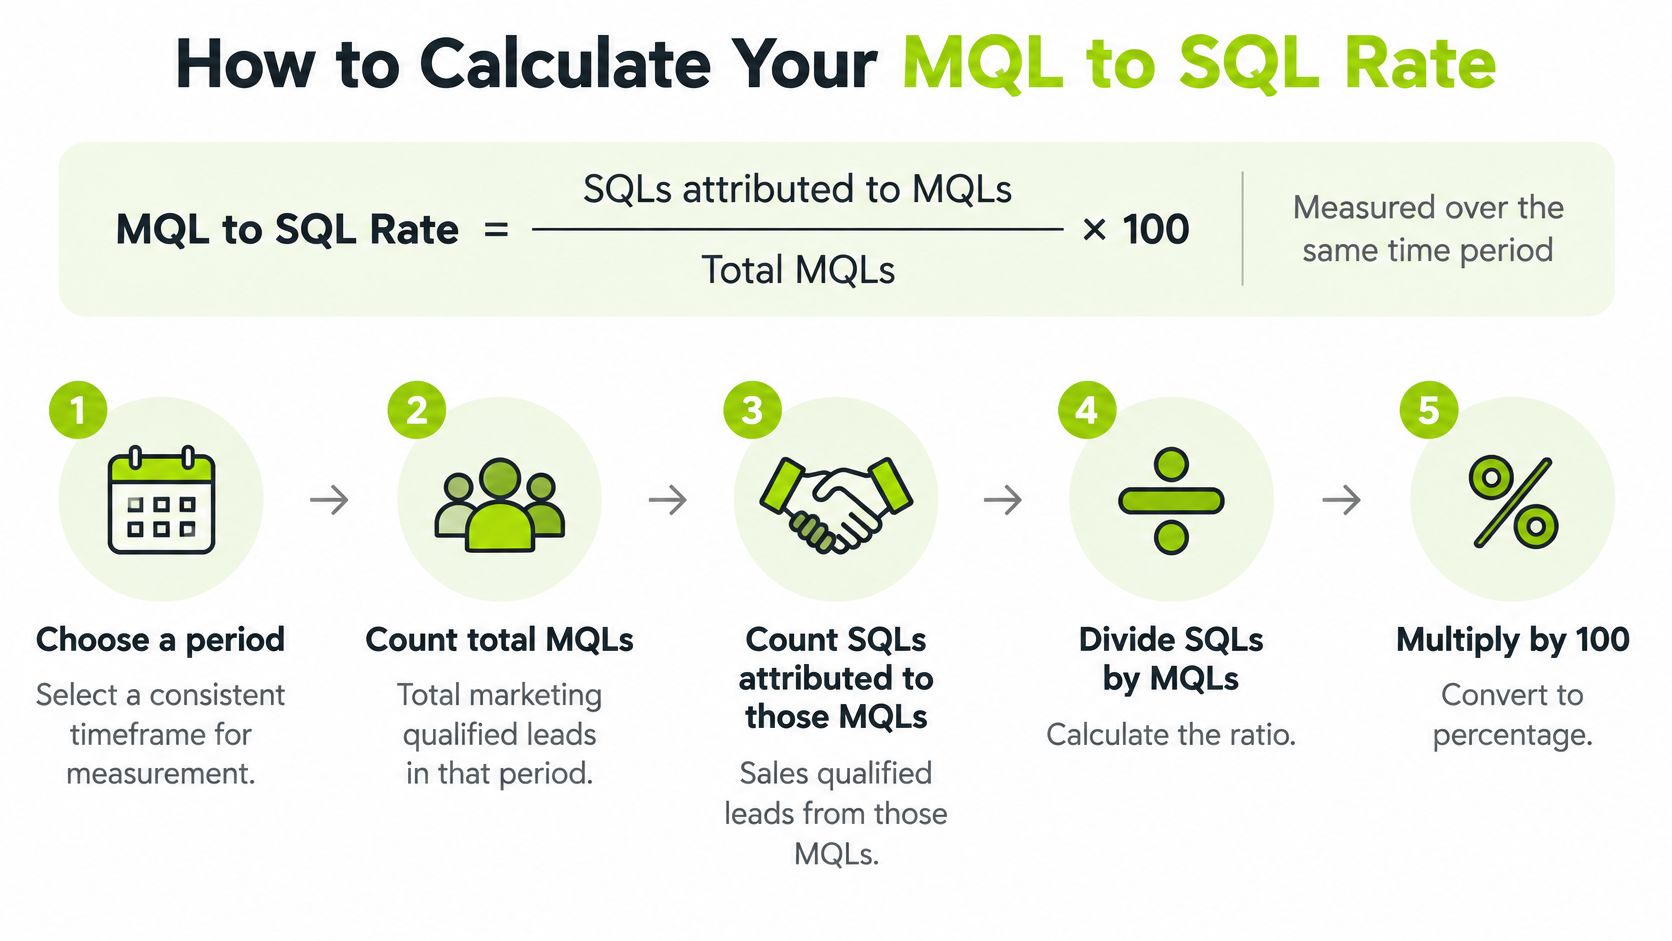
The five steps
- Choose the period. One quarter usually suits a B2B buying cycle. One month often doesn't, because slow deals land in a later cohort.
- Count the MQLs created in that period. Pull them from the lifecycle field or the marketing automation platform, not from a spreadsheet somebody maintains by hand.
- Count how many of those leads reached SQL status, using the date sales accepted them rather than the date the record was last edited.
- Divide and multiply. SQLs divided by MQLs, times 100.
- Repeat for each source and campaign. A single blended figure hides the differences that make it worth calculating.
A worked example
Say 1,000 MQLs arrive in a quarter and 130 reach SQL. The rate is 13%. At 20% the same volume would have produced 200 SQLs, 70 more qualified conversations from identical marketing spend. That gap is the reason published ranges are worth reading before you set a target.
Now split the same quarter by source.
| Source | MQLs | SQLs | MQL-to-SQL rate |
|---|---|---|---|
| Webinars | 200 | 60 | 30% |
| PPC | 800 | 110 | 13.8% |
| All sources | 1,000 | 170 | 17% |
The blended 17% is the number most dashboards display. It sits above PPC and below webinars, and tells a sales leader nothing about which of the two to fund.
Three slips that change the answer
- Counting lagged SQLs. SQLs created this quarter from MQLs created last quarter inflate or deflate the result. Fix the cohort at the start and follow it through.
- Mixing definitions mid-period. If the MQL rule changed in month two, the quarter's rate blends two different populations into one meaningless average.
- Dropping recycled leads. Leads returned to nurture still sit in the denominator unless the exclusion is written down before anyone compares rates.
Before comparing your figure with a published one, check that three things line up: the period, the denominator, and what counts as an SQL. If any of the three differs, you're comparing two measurements that happen to share a name.
Why Channels and Industries Shift the Rate
The same MQL-to-SQL rate can describe very different performance. A channel that attracts people already researching a problem may convert more readily than one built around low-context form fills, even when both teams use the same qualification rules.
A B2B SaaS benchmark compilation by Understory reports these rates by acquisition source:
| Channel | Reported MQL-to-SQL rate | Caution when comparing |
|---|---|---|
| SEO | 51% | Visitors may already be researching the problem |
| 46% | List quality and targeting affect the result | |
| Webinars | 39% | Attendees may be further along in their buying journey |
| 30% | The reason for each lead's engagement matters | |
| PPC | 26% | Campaigns may prioritise inexpensive form fills |
The same compilation reports a 13% average across broader B2B SaaS and industry samples. That blended figure sits below four of the five channel rates above, which shows how the mix of sources can shift a company's overall result.
Selection effects do most of the work
A channel can appear stronger because it reaches people with more immediate intent. Searchers and webinar attendees may have already taken steps to understand a problem; a paid campaign may instead find people willing to complete a form. The conversion rate reflects both the channel and the people it attracts.
Industry comparisons need similar care. Grey Matter's MQL-to-SQL benchmark compilation reports an overall range of 10–26% across 30 industries. Its examples show that rates vary by industry, while other reported comparisons place financial services, healthcare and manufacturing in different ranges. Treat these as context, not fixed targets: the populations and qualification rules behind each figure may differ.
The rule that survives: compare results within your own market, deal size, route to market and lead source. Then assess each channel by sales-accepted SQLs, opportunity size and the effort required to work them.
A lower conversion rate can still represent a stronger channel if its accepted SQLs create larger opportunities or require less sales effort. Use the same CRM definitions and track each source separately to make that comparison meaningful.
Read the Rate Alongside Sales Acceptance and Pipeline
A marketing dashboard can show a healthy MQL-to-SQL rate while sales accepts far fewer leads. The two figures describe different decisions: marketing records that a lead met its qualification rule; sales records whether the lead is suitable for follow-up.
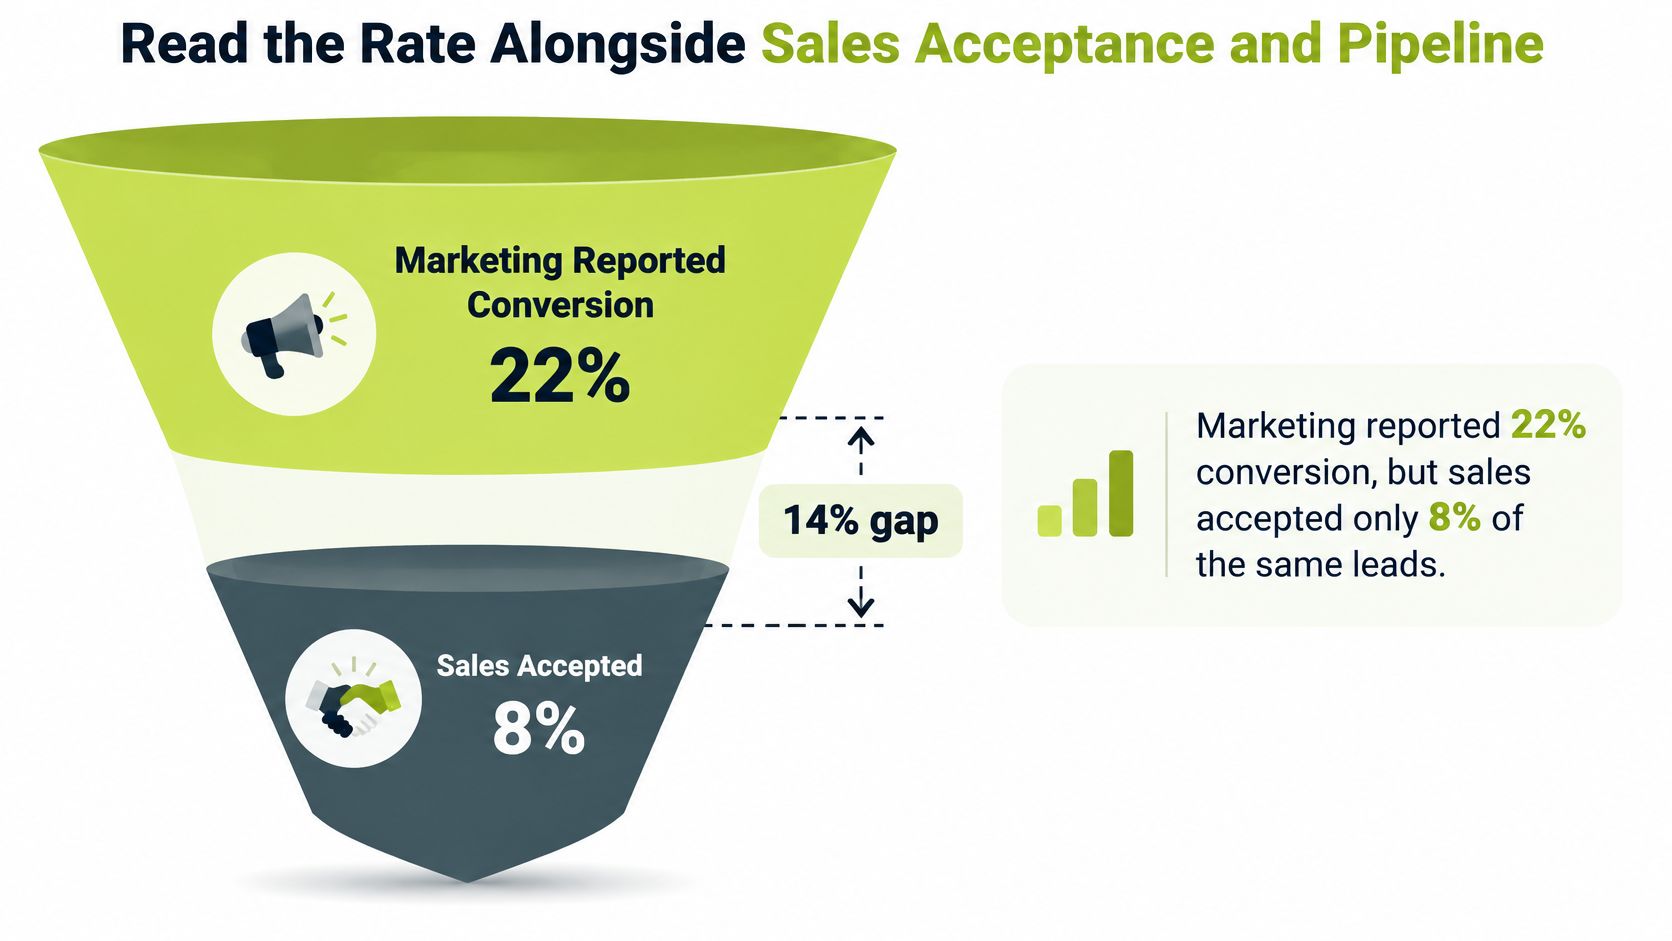
Keep three stages distinct. A lead becomes an MQL when it meets marketing's criteria, an SQL when sales accepts and validates it, and an opportunity when a commercial record opens. These are separate steps, so comparing one stage's rate with another can make a funnel look healthier or weaker than it is.
Track MQL-to-SQL conversion alongside sales acceptance and SQL-to-opportunity conversion. For example, 200 MQLs producing 26 SQLs gives a 13% MQL-to-SQL rate. If only 9 of those SQLs become opportunities, the conversion rate alone misses what happens after sales accepts them.
A lead can meet marketing's rule and still be rejected by sales as unsuitable, unreachable or lacking a credible buying situation. Reporting both conversion and acceptance makes that distinction visible. Marketing and sales alignment practices can help teams agree ownership, response times and how sales feedback informs qualification.
For teams setting up related measures, Trackingplan's KPI guide for paid media teams provides a reference for naming and defining marketing KPIs.
How to Interpret a Rate That Looks Too Low or Too High
A low rate often means qualification is strict rather than marketing weak. A high rate often means acceptance is loose, and sales absorbs the workload without gaining better pipeline. Neither reading is safe until the MQL and SQL definitions are settled and written down.

Work through six checks in order.
- Confirm the definitions and the time window, then leave them alone for the whole comparison.
- Split the rate by source, campaign and ICP segment. A blended number rarely identifies the problem, while one bad campaign usually does.
- Read the rejection reasons logged this period. They're already recorded and they point at the fix.
- Check response times. Slow first contact turns into a rejection about reachability, and the lead gets blamed for it.
- Check the data. Missing firmographics, duplicate contacts and out-of-order dates all bend the result without anyone touching the funnel.
- Change one thing. Tighten the MQL threshold, loosen it, or shift targeting. Doing two at once makes the next quarter unreadable.
A worked scenario. A team sits at 5% and assumes the market is the issue. The rejection log shows most rejections came from a single paid campaign, and almost none carried a recorded trigger. They add a trigger requirement to that source: fewer leads arrive, each one arrives with a named problem, and sales acceptance climbs. The rate rises because the input changed, not because the sales team tried harder.
A high conversion rate built on loose acceptance is a queue, not a funnel.
Make the rejection reasons your first move. They cost nothing to read and they name the fix faster than any benchmark.
Set Your Target from Your Own Baseline
Set the target from your own baseline, not from a published median. Take the last two to four quarters of rate by source and segment, then pick one source to improve first. A blended target hides exactly where the gap sits, so it can't tell anyone what to do on Monday morning.
Make the target a small, dated step. Moving a PPC-sourced rate from 13% to 15% over two quarters is something a team can work against. "Reach 25%" isn't. Hold the step against two downstream numbers before calling it a success: the sales acceptance rate and the SQL-to-opportunity rate. A conversion rate climbing while acceptance stays flat is a definition change, not an improvement.
Measure the outcomes that pay for the work: accepted SQLs that reach a qualified conversation, booked meetings, and the opportunities those meetings create. H2 assesses its own campaigns by those three, treating opens and raw send volume as diagnostic signals rather than results.
Review the baseline each quarter, and note any change to the MQL threshold or handoff rules beside it. Otherwise, a later rise in the rate gets read as better lead quality when it was caused by a looser bar.
Where the blocker is routing rules, reporting or CRM workflows, the custom GTM system builds service sets out how that work is scoped, tested and handed over. If the need is a running outbound programme rather than a system, current pricing sits on the H2 pricing page.
H2 builds the qualification rules, routing and reporting that make an MQL to SQL rate mean something, whether that arrives as a fixed system or a managed outbound programme. The team works from your commercial rules and your existing CRM, so the figures you report afterwards match how sales works. Visit H2 to talk through the handoff and routing problem you want to solve first.
