Market mapping is a structured way to identify a market's participants, segments, needs, competitive positions and relationships, then organise that information so a business can decide where to focus. It's broader than segmentation or a prospect list because it shows the whole market structure before a team chooses which accounts deserve time.
That distinction becomes urgent when a founder or sales leader faces a spreadsheet of technology companies that all look plausible. Without a map, research time spreads evenly, messages stay generic, and strong accounts receive the same attention as poor fits.
What Is Market Mapping for B2B Teams
A broad list answers one question only: which companies exist. Market mapping answers harder commercial questions. Which groups have the problem, which can buy, how do they solve it now, who influences the decision, and where does the seller have a credible advantage?
The intellectual foundation is market segmentation. Wendell R. Smith argued in 1956 that a broad, heterogeneous market could be viewed as several smaller, relatively homogeneous markets with different product preferences, an argument set out in Smith's Journal of Marketing article on differentiation and segmentation.
Segmentation Divides, Mapping Shows Structure
Market segmentation is the narrower step of dividing a market into manageable groups with shared characteristics such as industry, company size or customer needs. Market mapping is broader because it defines, measures and visualises the total potential market first, including companies, customer groups, competitors, distribution routes and unmet gaps, as explained in Lead Genera's definition of market mapping and segmentation.
That order matters. A team that segments too early may build neat groups inside the wrong market boundary. A team that maps first can see adjacent segments, intermediaries and competitor positions before committing research and outreach capacity.
- Classify accounts with a purpose: Industry, size, geography, technology, buying problem, urgency and suitability only help when each field changes a decision.
- Connect categories to evidence: The map should show why an account belongs in a priority group, not just that it matches a filter.
- Separate research types: Teams comparing broad market learning with competitor tracking can use research goals, methods, and KPIs compared to keep objectives distinct.
A prospect list names companies. A market map explains where effort belongs and why.
What is market mapping in practice, then? It's a decision tool for defining an ideal customer profile, prioritising accounts and tailoring messages to observable differences. The next step is building that tool from layers a team can maintain, covering account fit, buyer roles, routes to market and timing.
The Four Layers of a Useful Market Map
A maintainable map doesn't collect every available field. It combines four layers, and each layer changes how accounts get ranked for outbound.
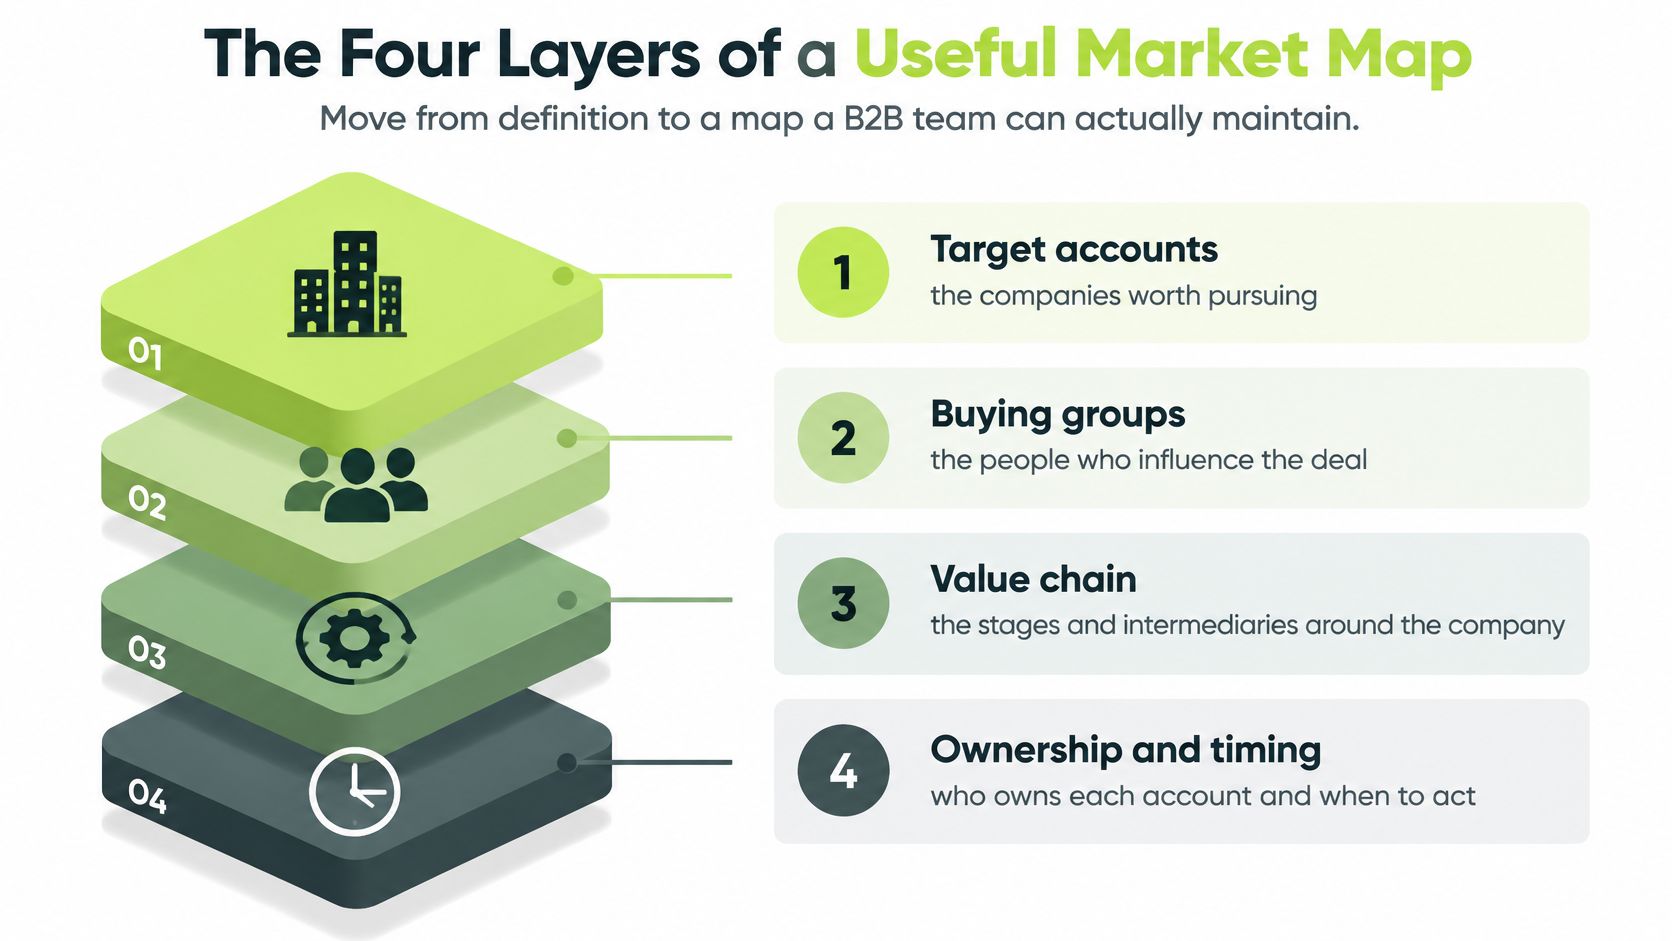
Layer One and Two Cover Fit and Change
Firmographics define basic fit because companies, rather than individuals, are the primary unit of account selection. Relevant fields include industry, location, revenue, employee count, legal structure and business performance, with size normally combining revenue and employee count, as set out in OpenStax's guide to B2B market segmentation fields. Performance can include market share, sales and changes in employee or revenue levels.
A practical filter shows why this matters. UK software companies with 50 to 200 employees aren't the same target as enterprise manufacturers, even when both sit inside a broad technology category. Teams refining those boundaries can use guidance on B2B customer segmentation criteria to test whether each field separates meaningfully different buyers.
Buying signals sit on top of fit. A vacancy, technology adoption or public activity may indicate a possible change or problem, while competitor positioning shows where an account may be underserved, and stakeholder roles identify the people involved, as described in Reachly's breakdown of market mapping layers for outbound.
Signals Are Evidence, Not Proof
- Firmographics: Does the account match the basic profile?
- Buying signals: What changed recently, and when was it verified?
- Competitor position: Which alternative is in place, and where might it fall short?
- Stakeholder roles: Who feels the problem and who can block the purchase?
A job vacancy, technology choice or social interaction should be treated as evidence for research, not proof of purchase intent, because none independently establishes readiness to buy. Teams gathering competitor evidence from public sources may also find seven scraping tactics from Scrappey useful for structuring collection, provided each source links to an explicit qualification rule.
The output is a ranking by fit, need and accessibility, with uncertainty recorded. Fields that don't change priority, messaging or ownership don't belong on the map.
Mapping Buyer Roles Inside Target Accounts
Selecting the right company doesn't reveal the route to a decision. Inside one qualified account, different functions hold different problems, evidence thresholds and objections.
Gartner reported in May 2025 that 74% of B2B buying teams experienced unhealthy conflict during a decision, and teams that reached consensus were 2.5 times more likely to describe the deal as high quality, according to Gartner's May 2025 sales survey release on buying team conflict. An account-centric map can therefore look complete while missing the people who determine the outcome.
What to Record for Each Role
The distinction between company fit and individual relevance mirrors the difference explained in the comparison of ICP and persona definitions. The ICP qualifies the account. Role mapping qualifies the conversation.
Buyer Roles to Record on a B2B Market Map
| Role | Commercial question | Evidence to record | What not to assume |
|---|---|---|---|
| Economic buyer | Who owns the budget and outcome? | Problem cost, approval route, priority | Seniority means active involvement |
| Technical evaluator | What proof must the solution pass? | Current stack, criteria, constraints | Technical interest means budget support |
| User | Who feels the daily problem? | Workflow pain, team size, workarounds | Pain alone creates purchasing authority |
| Procurement | What process governs purchase? | Vendor rules, security steps, timing | Late involvement means low influence |
| Champion or blocker | Who helps or resists internally? | Stated position, influence, objection | A positive reply means internal consensus |
One Contact or Several Functions
One well-evidenced contact can be enough for an early conversation when the problem sits inside one team and the purchase route looks simple. Several functions need research first when the problem crosses teams, when technical evaluation is likely, or when procurement and budget ownership sit apart.
Practical rule: Map wider when consensus is required, narrower when one role owns both problem and decision.
A job title or social signal still doesn't prove intent. The CRM record should carry each role's problem, evidence threshold, influence, likely objection, message variation and a named owner. Coverage becomes a repeatable rule rather than a longer contact list.
Finding Gaps Across the B2B Value Chain
A company-only map misses the organisations around the target account. Suppliers, partners and distributors often control access, shape requirements or influence which vendors reach the final buyer.
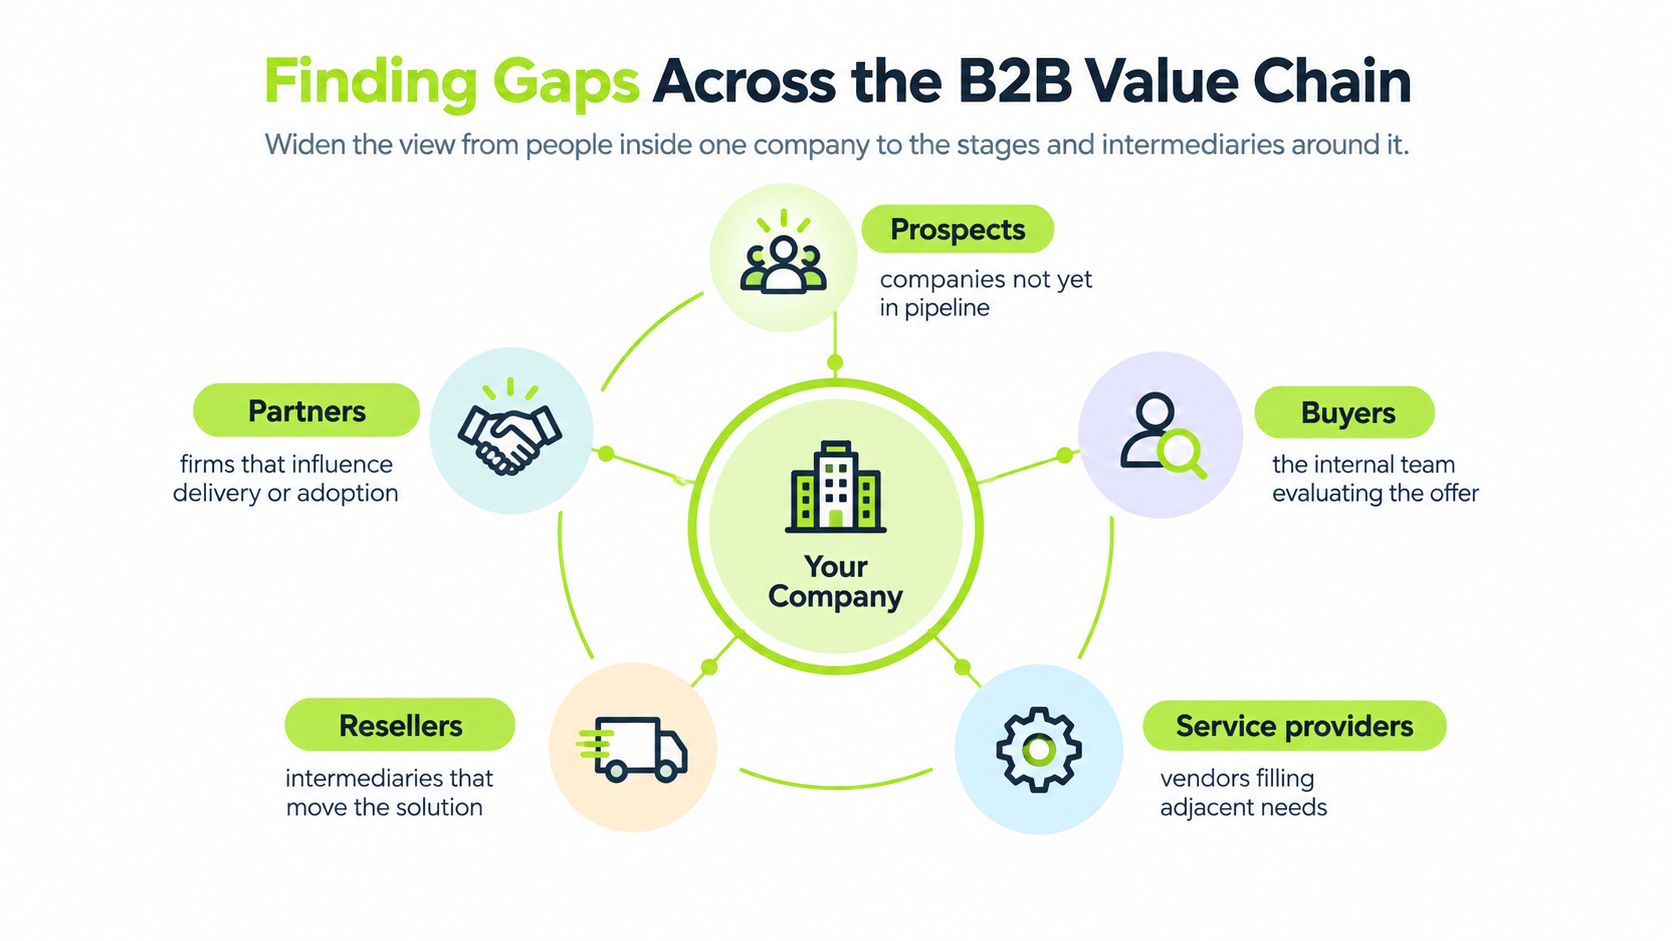
B2B markets commonly contain a production stage, where manufacturers create products, and a distribution stage, where retailers or distributors move them towards end users, and a complete map identifies players at each stage plus the channels connecting them, as outlined in CEOpedia's explanation of market mapping and value chains. That structure changes the go-to-market choice directly.
Four Routes the Map Can Reveal
- Sell directly: The end user owns the problem, budget and buying process.
- Approach channel partners: An intermediary controls reach or delivery into the target accounts.
- Target suppliers: The commercially affected party sits upstream from the visible buyer.
- Separate the message: Each role in the chain feels a different cost, so one message fits none well.
Consider a hypothetical example. A software services firm finds operations teams struggling with a reporting problem, but a platform partner manages those accounts and sets the tooling shortlist. Direct outreach to end users may generate interest without a route to purchase. The partner needs its own mapped position, message and owner.
Real Gaps Versus Missing Data
A gap only matters when three conditions hold. A defined group has an unmet need, a reachable route exists, and the seller holds a credible advantage over the current alternative. An account with no recorded competitor isn't automatically underserved. It may be under-researched.
Teams should mark unknowns as unknowns. That discipline stops empty fields from masquerading as opportunities, and it directs research towards the stage where evidence is weakest.
Market Mapping Examples from Real Campaigns
Published engagements show how evidence layers combine in practice. The measures differ by engagement, so pipeline, leads, meetings and scored accounts shouldn't be treated as interchangeable results.
Pipeline Built From Tighter Account Selection
For Ravn, a software development studio building outbound beyond reputation and referrals, the reported result was $4 million in new pipeline, attributed to the campaign by co-founder Micah Lisonbee. The mapping task was defining which companies justified outreach rather than relying on inbound reputation.
For Full Scale, 50,000 companies were analysed and scored using public company data and AI website analysis to understand what businesses built, exclude poor fits and prioritise accounts, with reported savings of 5,000 hours and $125,000. Scoring at that scale only helps when exclusion rules are as explicit as inclusion rules.
For Consider It Done Technologies, reported results were $2.7 million in pipeline. CEO Eugene Fine estimated that 80 to 90 percent of supplied leads were qualified and that the work produced 20 to 30 additional proposals. Those figures are estimates, and they describe lead quality and proposal volume rather than closed revenue.
Signals Used as Research Triggers
For Main Street DBAs, database-administration vacancies, technology platforms and team capacity helped identify possible support gaps. The reported outcome was 134 leads and $873,000 in pipeline. No single vacancy proved intent. The combination of role gap, relevant platform and limited internal capacity made the account worth investigating.
Other engagements used narrower measures. Korporatio reported 73 demos in the first month, with campaigns matched to company stage, jurisdiction and structural needs, which is meeting volume rather than pipeline. Grafbase reported 50 leads, shaped by platform-engineering roles, competing technology use, relevant social engagement and signs of dissatisfaction with alternatives.
Teams selling through digital channels face the same layering problem across buyers, intermediaries and platforms, a pattern also visible in B2B ecommerce insights for growth teams.
The lesson across these examples is how evidence was combined, not an expectation that every campaign produces the same result.
Each case paired fit with a specific, checkable condition. That's what separates mapping from list buying.
How to Keep a Market Map Current
A quarterly snapshot decays because buyers move before sellers arrive. A 2025 study reported that 94% of B2B buying groups ranked vendors before first contact, while the average buying cycle shortened from about 11 months in 2024 to 10 months in 2025, according to the 2025 Buyer Experience Report summary on Business Wire.
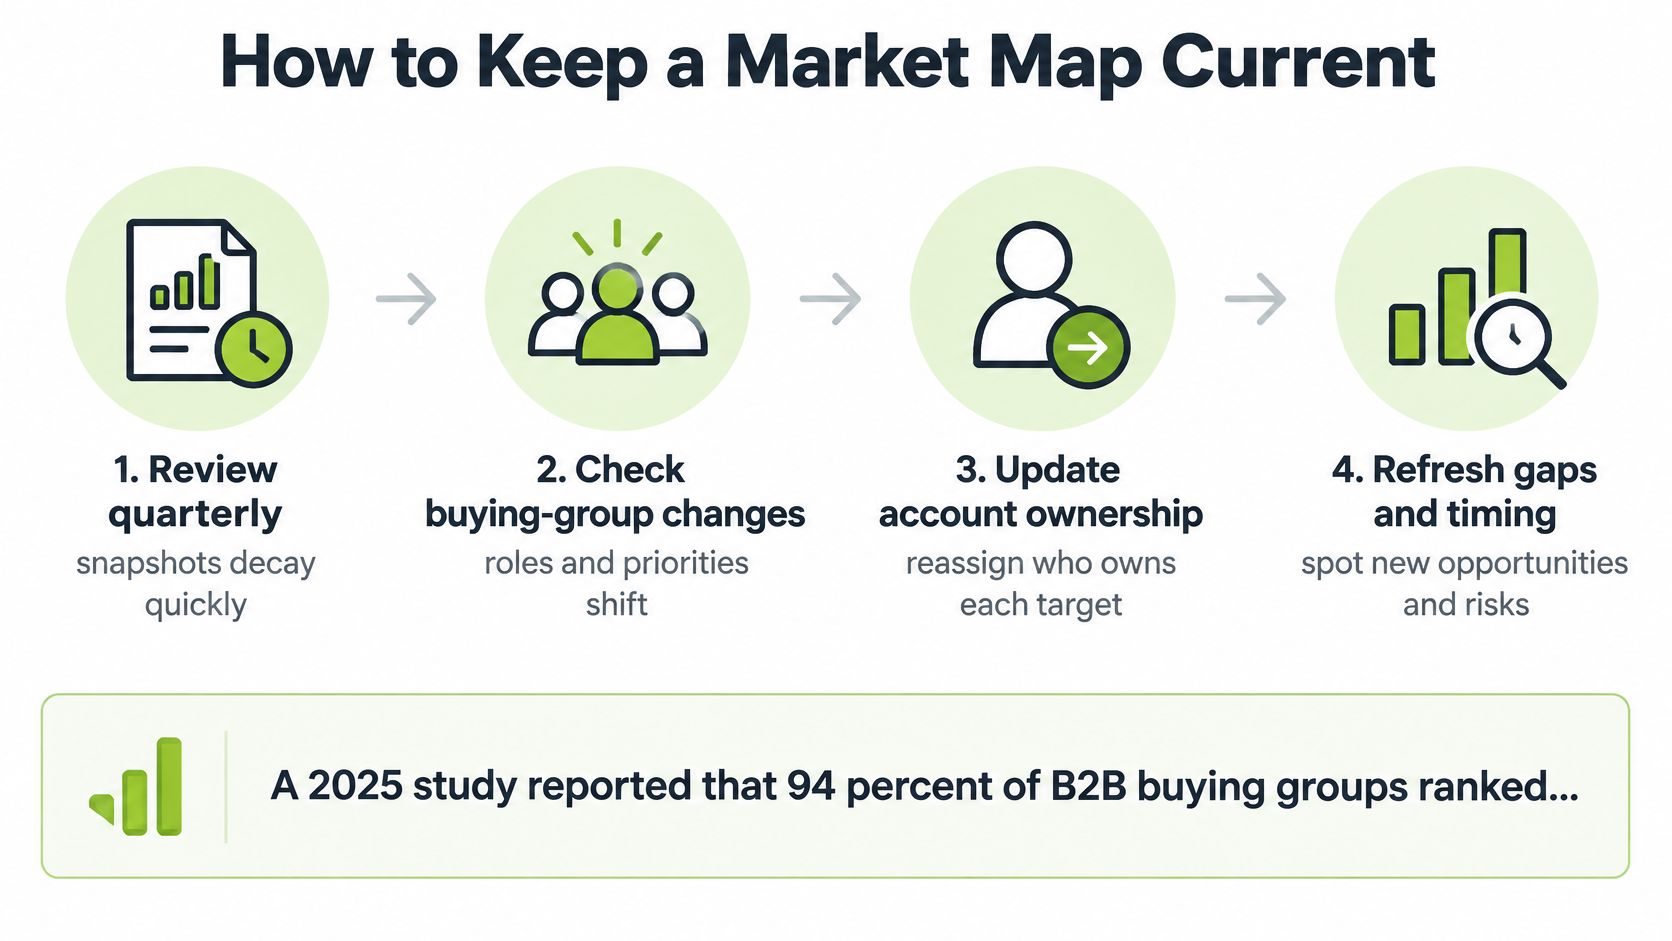
The operating questions become what changed, why it matters now, and what evidence would justify contact. Fit alone stops being enough.
Changes Worth Tracking
- Leadership and structure: New executive hires, funding or restructuring can reset priorities and ownership.
- Capacity signals: Relevant vacancies may show a team under strain or a function being built.
- Technology and market moves: Adoption decisions, product launches and regulatory pressure can create new requirements.
- Dissatisfaction evidence: Public complaints or switching behaviour matter more when corroborated by a second source.
A Light Refresh Loop
A signal has a useful lifetime. An old vacancy or stale technology record shouldn't keep the priority of a recently verified trigger. Every signal on the map needs a source date and a decay rule that lowers its weight as it ages.
- Refresh the source: Recheck the original evidence rather than copying an old CRM note forward.
- Record date and confidence: Separate weak indicators from corroborated conditions in the record itself.
- Route to an owner: Assign the account with the reason for contact and the evidence attached.
- Feed learning back: Log replies, objections and sales feedback so targeting and timing improve.
Activity metrics don't substitute for this loop. Opens and single social interactions show behaviour, not intent. A short, regular review cadence protects data quality without turning mapping into constant manual research.
How to Choose a Market Mapping Approach
The right route depends on team time, data quality and how quickly pipeline is needed. Three routes cover most situations, and each puts the workload in a different place.
Comparing the Three Routes
Fully managed outbound suits a company with a proven offer, capacity to handle sales conversations and no appetite to run outbound internally. It covers research, audience definition, list building, enrichment, verification, infrastructure, deliverability, copy, testing, reply handling and meeting booking. Teams weighing that scope can review the fully managed outbound service scope.
A custom system build suits a team with a specific bottleneck in audience discovery, buying signals, scoring, CRM routing or automation. The build needs inputs, decision rules, integrations, edge cases, testing, documentation and a runbook defined before work starts, as described under custom GTM system builds and their scope.
A private workshop suits a team that wants to learn the judgement behind research, qualification, messaging and cost control, leaving with worked examples and a handbook. Format and content details sit under private GTM workshops for sales and marketing teams.
Clay can operate as one tool inside a wider system. It isn't the offer itself, and tool access without qualification rules produces faster list building rather than better mapping. Sizing the opportunity properly also helps, since a clear addressable market calculation method shows whether the mapped market can support the chosen route.
Current scope and pricing belong on the H2 pricing page with service options rather than in an educational guide that ages. The practical next step is a 15-minute introductory call to discuss audience, evidence and the current constraint. A free GTM strategy is also available through the website for teams that want the conversation documented.
H2 builds and runs market mapping as part of fully managed outbound, custom GTM systems and private workshops, covering account research, qualification rules, buying signals and campaign execution. Teams that want a map which ranks accounts by evidence rather than guesswork can visit H2 to book a 15-minute introductory call.
