A sales leader asks a deceptively simple question: is this market large enough to justify our outbound budget? The team opens an industry report, finds a large category figure, and starts planning campaigns against it. A few months later, reps are working accounts the product can't serve, contact data is thin, and the supposed opportunity bears little relationship to the pipeline the team can create.
A useful addressable market calculation starts somewhere else. It connects market potential to the accounts you can identify, the buyers you can reach, the pricing those accounts can support and the sales capacity available to win them. TAM, SAM and SOM aren't decorative labels for an investor slide. Used properly, they're operating measures for deciding where outbound should focus and what the team can realistically achieve.
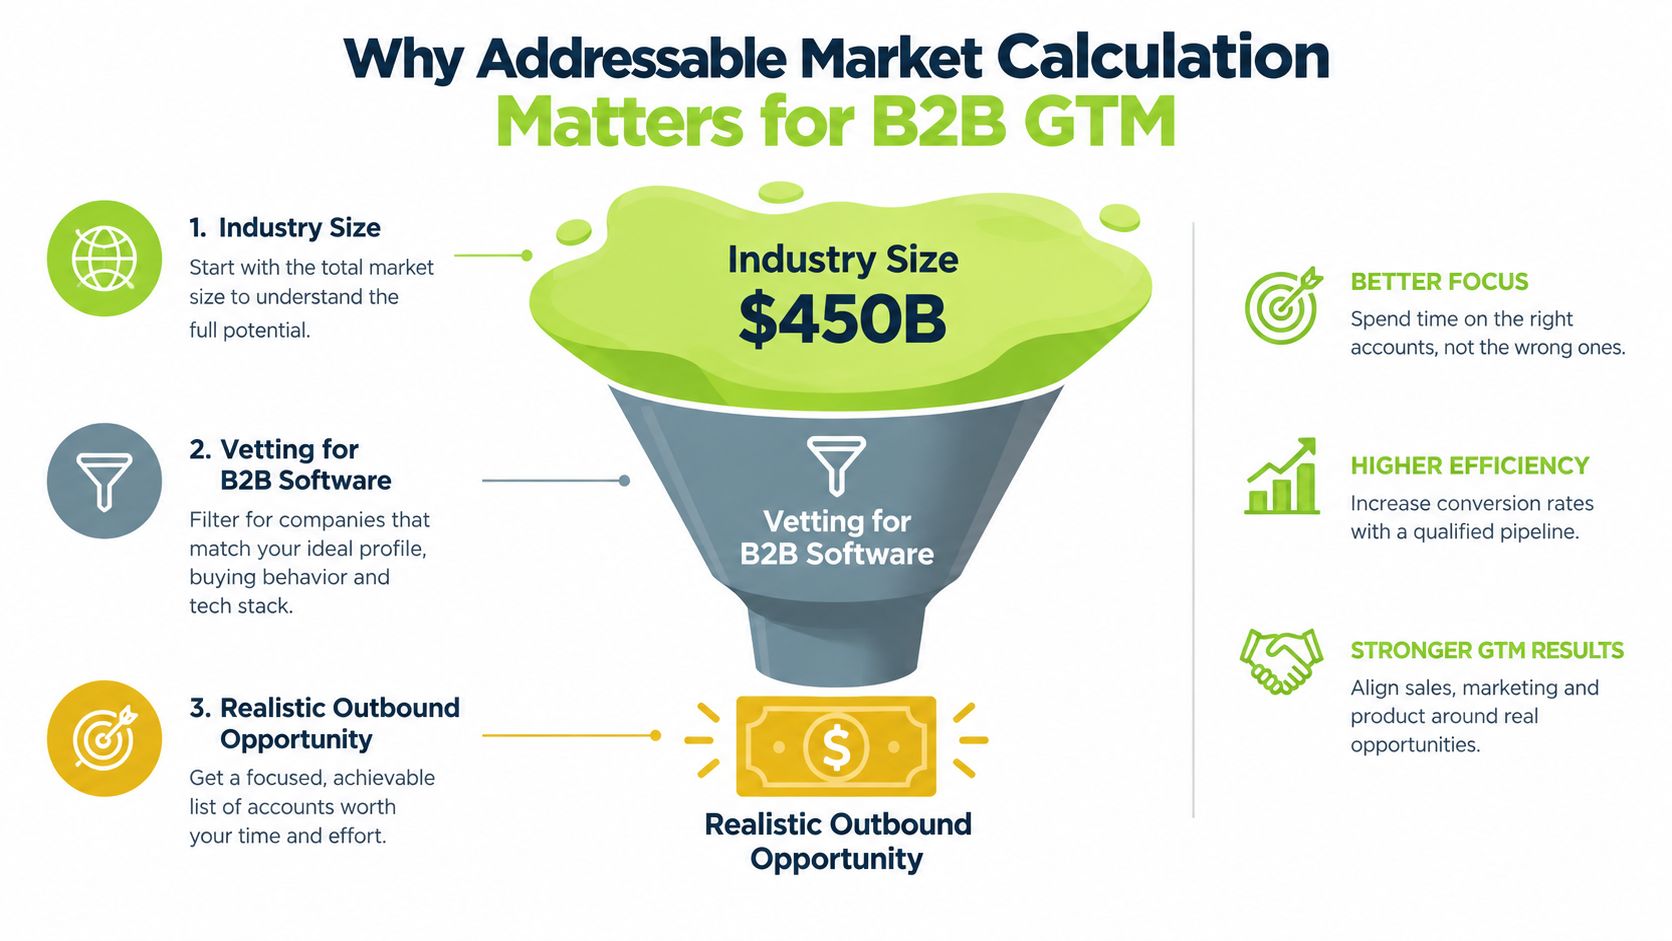
Why Addressable Market Calculation Matters for B2B GTM
A published industry number answers a broad question: how much revenue might exist across a category? It doesn't tell a sales leader which companies fit the offer, which locations the team can serve, which buying roles matter or how many accounts can receive a credible sequence this quarter.
Total Addressable Market, or TAM, represents the revenue available if the company captured the entire defined market. Serviceable Addressable Market, or SAM, removes customers, locations, industries and use cases the business can't serve. Serviceable Obtainable Market, or SOM, estimates the portion of SAM the company can realistically win given its resources, competition and time. This nested framework is outlined in Statista's market-sizing methodology.
The number must change a sales decision
Each layer has an operational use:
- TAM supports strategic scope: It shows whether the broader problem could support the business at all.
- SAM shapes targeting: It defines the accounts that match current product, geography, delivery and commercial constraints.
- SOM sets execution expectations: It forces the team to account for capacity, competitive pressure, timing and the number of opportunities it can realistically pursue.
That last distinction matters most. A large TAM can coexist with a small, highly workable SAM. A healthy SAM can still produce an unrealistic SOM if the sales team lacks enough prospecting time, relevant contacts or delivery capacity.
Practical rule: If the calculation doesn't affect account selection, campaign design, hiring, territory allocation or pipeline expectations, it's probably still a presentation number.
The worked example throughout this guide is a UK-based B2B managed database service selling to software companies. The broad market will be narrowed by service fit, geography, reachable accounts and sales capacity. By the end, the output won't just be a revenue estimate. It'll be a set of assumptions that a commercial team can test against a real account list and a real outbound motion.
The Core TAM SAM SOM Formulas With a Worked Example
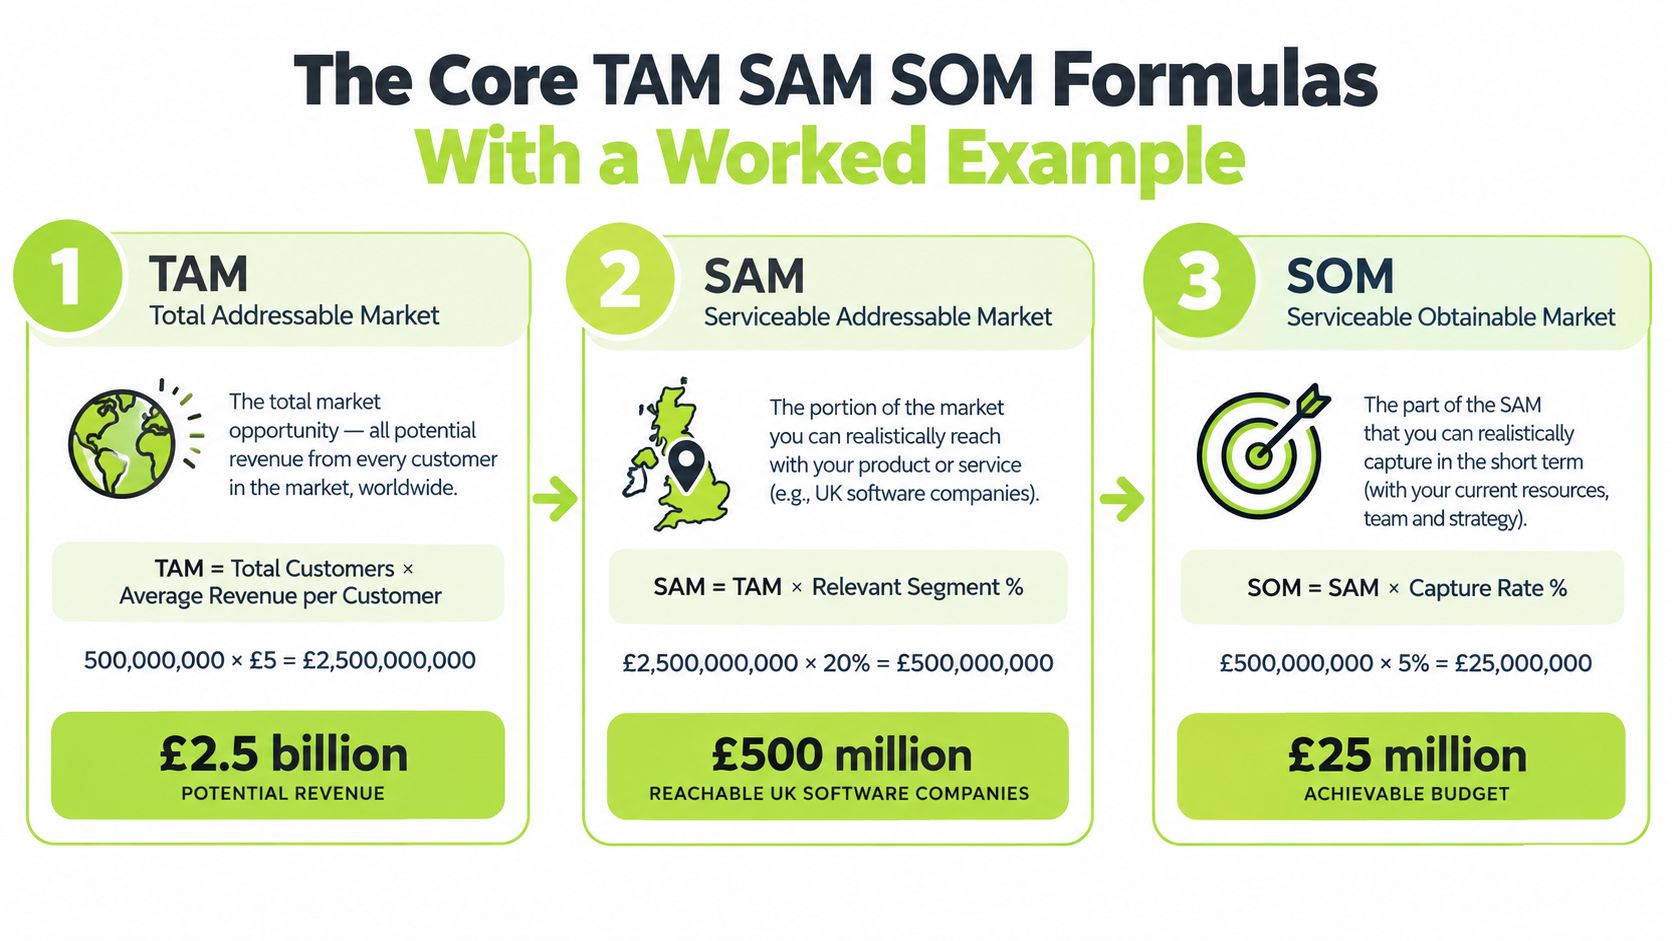
The basic formulas are straightforward. The discipline lies in defining each input accurately.
TAM = number of potential customers × annual revenue per customer
For the managed database service, suppose 100,000 qualifying businesses could each generate £2,000 annually. The theoretical TAM is therefore £200 million. This assumes every business in the defined universe could buy and that the annual revenue assumption applies consistently.
SAM = TAM × proportion matching service constraints
Now apply the constraints. Perhaps geography and product capability reduce the reachable segment to 30%. SAM becomes £60 million, calculated as £200 million multiplied by 30%. This is no longer the whole theoretical market. It represents the part the service can support within its current operating boundaries.
SOM = SAM × defensible capture rate
Finally, apply a realistic penetration assumption. A 3% capture rate produces a £1.8 million SOM, calculated as £60 million multiplied by 3%. The result isn't a promise or a sales quota by itself. It's a starting point for testing whether the assumed account count, annual value and commercial capacity make sense.
What the example does and doesn't prove
The calculation creates a clear chain:
| Measure | Calculation | Result |
|---|---|---|
| TAM | 100,000 businesses × £2,000 | £200 million |
| SAM | £200 million × 30% | £60 million |
| SOM | £60 million × 3% | £1.8 million |
The chain is useful because every number can be challenged. Are there really 100,000 qualifying businesses? Does £2,000 reflect likely annual revenue across segments? Does the service genuinely reach 30% of them? Can the team support a 3% capture assumption against competitors and available selling time?
A published industry forecast can't answer those questions. It may define the category more broadly than the product, include geographies the company doesn't serve or measure total category spend rather than attainable revenue. Treat it as context, not as the opportunity a sales team can automatically pursue.
Top-Down Versus Bottom-Up Versus Demand-Side Sizing
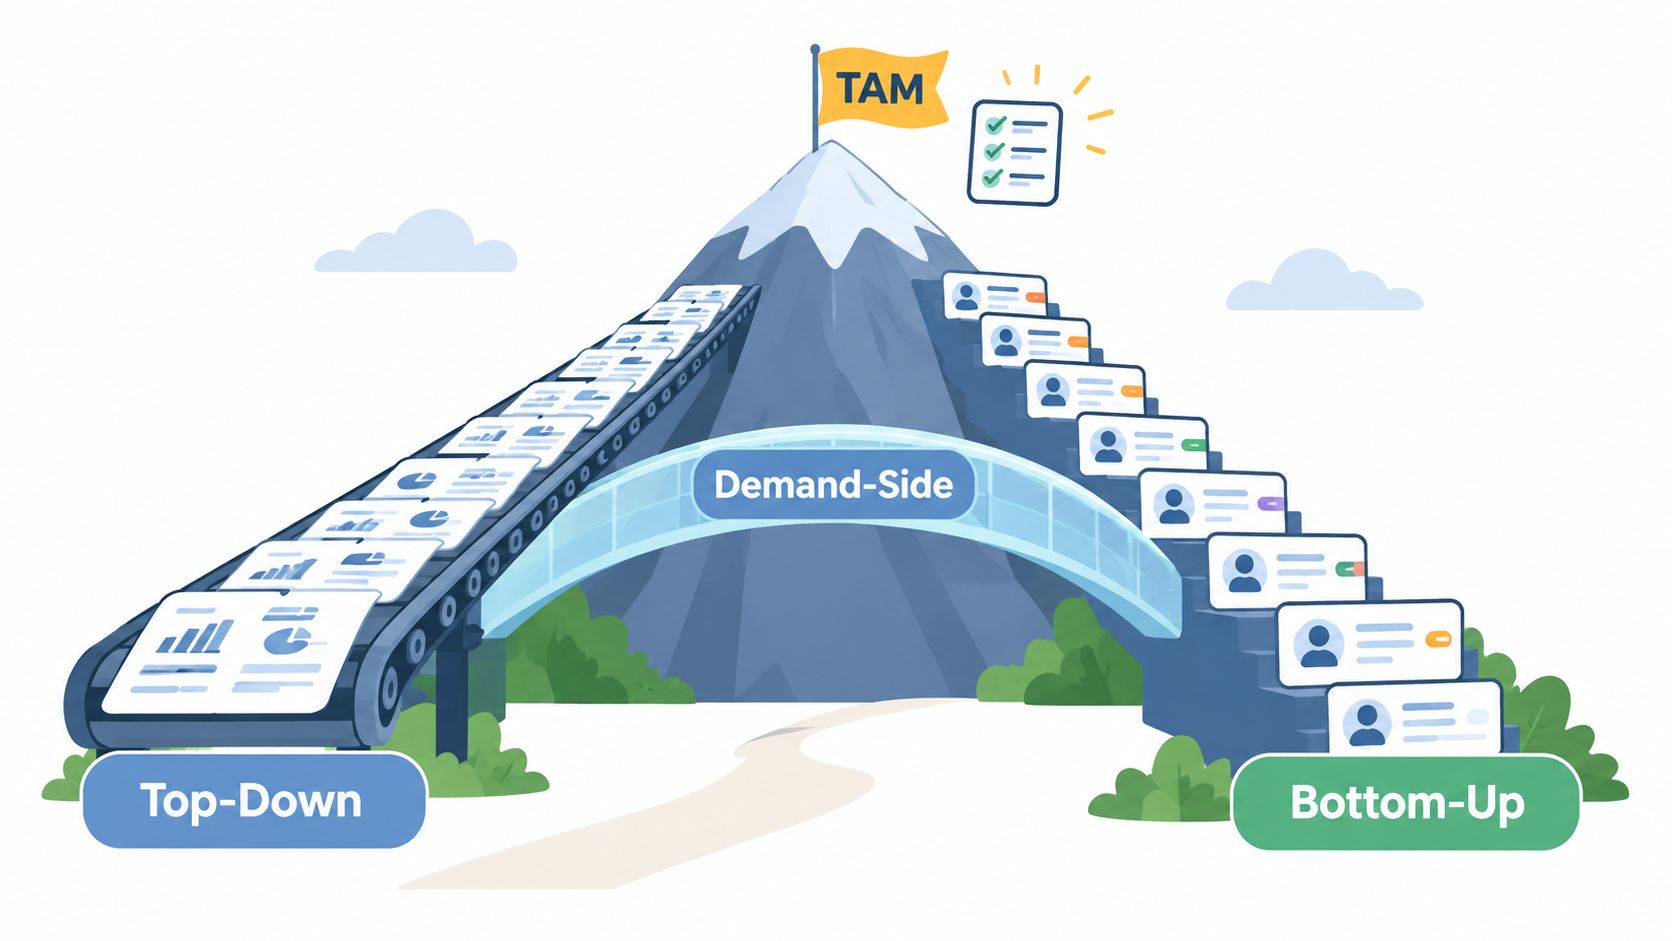
A market estimate becomes more trustworthy when you build it independently from several directions. The three most useful views are top-down industry sizing, bottom-up buyer-unit economics and demand-side displacement analysis.
Top-down is fast, but blunt
Top-down sizing starts with an industry estimate and applies filters for geography, segment, product applicability or use case. It's useful when a team needs an initial view quickly, especially in an unfamiliar category. It can expose a market that is obviously too small or indicate that a strategic opportunity deserves deeper investigation.
The weakness is the denominator. Industry categories often bundle adjacent products and customers, while analyst definitions rarely match an individual company's ICP. Top-down sizing is a poor basis for territory design or outbound capacity unless the team validates it against named accounts.
Bottom-up connects directly to sales reality
Bottom-up sizing starts with account counts and buyer economics. The team identifies companies matching its inclusion rules, assigns an annual value by segment and sums the result. This approach takes more work, but it produces a number that can flow into list building, territory planning and campaign prioritisation.
For a niche B2B market, one source may carry an error margin of 50% or more, while multiple independent sources and expert validation may narrow uncertainty to roughly ±15–20%, as discussed in this market-sizing analysis. These aren't guarantees of accuracy. They're reminders that precision should reflect evidence quality.
Demand-side analysis catches hidden substitution
Demand-side sizing asks what budget, labour or time the buyer would have to displace to purchase the offer. A managed database service might replace internal on-call work, a fragmented support arrangement or the cost of recruiting specialist capability. The relevant question isn't only how many companies could benefit. It's whether the buyer has a commercially credible reason and budget path to act.
Reconcile the three estimates rather than averaging them. If top-down suggests a vast category but bottom-up finds a modest account universe, inspect the category definition. If bottom-up revenue is high but demand-side budgets are low, challenge the pricing assumption. Disagreement is often the most valuable output because it shows where the model is hiding risk.
Turning the SAM Into an Account List Sales Can Actually Work
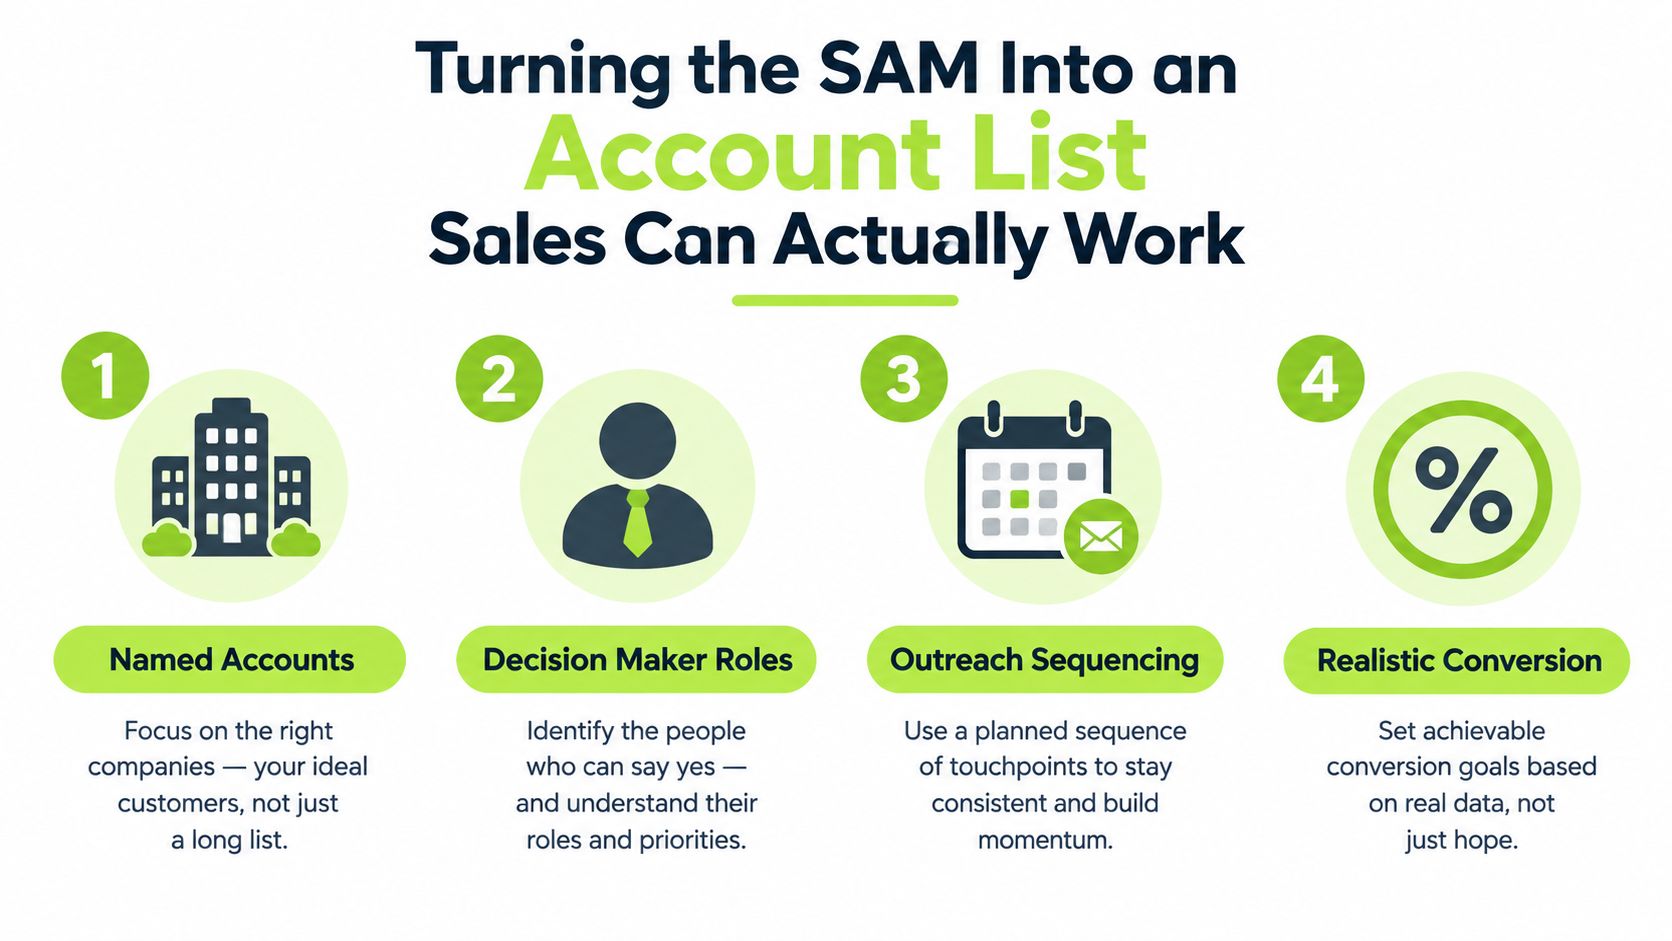
A SAM figure becomes useful only when it can be translated into named accounts, reachable buying roles and plausible timing windows. “The UK software market” isn't a prospecting list. It doesn't tell a rep whom to research, which role to contact or why the account might act now.
Start with explicit inclusion rules for the managed database example:
- Company profile: Software companies with a product or operating environment that requires managed database expertise.
- Service fit: Accounts whose technical complexity, support needs or team structure match the delivery model.
- Geography: Organisations inside the service team's supported locations and coverage hours.
- Buying roles: CTOs, heads of engineering, platform leaders or other people responsible for database reliability and technical resourcing.
- Timing signals: Database-related vacancies, infrastructure changes, growth in engineering capacity, migration activity or visible support gaps.
These filters turn the SAM from a revenue total into a queryable universe. They also expose the difference between a theoretical account and a reachable prospect. An account may fit the firmographics but lack a discoverable decision-maker, a relevant trigger or a credible route into the buying group.
Account quality beats list volume
A list of 5,000 accounts with clear qualification rules can be more valuable than a list of 50,000 loosely related companies. The smaller list can support consistent research, contact verification, message customisation and feedback analysis. The larger list may create sending volume without improving the quality of conversations.
Teams should separate three layers in the account model:
- Eligible accounts, those that match the core service and market rules.
- Prioritised accounts, those with stronger fit, visible triggers or a more accessible buying group.
- Active campaign accounts, those the team can research and contact within the current sequencing window.
The segmentation principles in this B2B customer segmentation guide are especially relevant here. Segmentation should help the team make different decisions, not just add labels to a CRM.
SOM must then be checked against sales capacity. If the model assumes more conversations, proposals or onboarding work than the team can handle, the capture rate is decorative. Reduce the active account universe, extend the timeframe or revise the assumed capture rate. The correct answer is the one the operating team can support.
When Seat-Based Sizing Stops Working and What to Do Instead
Many software models begin with a convenient formula: potential seats multiplied by annual price. That logic works when the product is bought and expanded by user count. It becomes unreliable when customers pay for usage, consumption, agents, outcomes or a hybrid of these.
A recent Baker Tilly SaaS sector report cites Gartner's projection that at least 40% of enterprise SaaS spending could migrate to usage, consumption, agent and outcome-based models by 2030, while the share associated with per-user licensing could fall from 21% to 15%. The same source reports that 80% of surveyed organisations provide developers or technical teams with a dedicated token or large-language-model budget, and 47% report reallocating more than 10% of existing software budgets to generative-AI projects.
These figures matter because pricing changes the unit of analysis. A product priced by seats can be estimated from headcount and adoption. A usage-priced product requires assumptions about workloads, frequency, intensity, expansion and customer behaviour. An outcome-priced service may depend on the value created or cost avoided, not the number of users.
Model the commercial paths separately
Build separate scenarios rather than forcing one average price into the model:
| Scenario | Main unit | Questions to answer |
|---|---|---|
| Seat-based | Users or licences | How many eligible users adopt, and at what tier? |
| Usage-based | Events, tokens, compute or volume | What workload exists, and how does usage expand? |
| Hybrid | Base fee plus consumption | Which revenue is committed, and which varies? |
| Outcome-based | Business result | What result is measurable, and who owns the budget? |
The scenarios should use different account assumptions where appropriate. A large engineering organisation may be attractive under usage pricing but uneconomic under a low seat count. Another prospect may have limited usage but a costly operational problem that supports outcome pricing.
Include budget substitution
New spend isn't always incremental spend. A buyer may fund the purchase by cancelling a tool, reducing a licence tier, consolidating vendors or moving work away from internal staff. If the model treats every sale as additional budget, it will overstate the demand available.
The practical calculation should therefore include trigger events, workloads and incumbent costs. Ask what changes before a purchase becomes possible. A new product launch, infrastructure migration, reliability problem or hiring freeze may matter more than the account's employee count. The market isn't only a population of buyers. It's a set of commercial situations in which a purchase can be justified.
A Spreadsheet Layout You Can Copy and Use This Week
A useful model separates inputs, calculations and outputs. Don't bury assumptions inside formulas. Put them in visible cells so the sales, finance and marketing teams can challenge them without rebuilding the workbook.
Suggested workbook tabs
| Tab | Contents |
|---|---|
| Inputs | Account universe, annual value by segment, geography, service constraints and capture assumptions |
| TAM | Potential customer counts multiplied by annual value |
| SAM | Filters for product fit, location, delivery capability and supported use cases |
| SOM | Capture scenarios tied to competition, capacity and time |
| Account list | Named companies, segments, buying roles, signals, source dates and qualification status |
| Sensitivity | Low, base and high cases for the assumptions that move the result most |
Colour-code assumptions in one colour and formula outputs in another. Keep source notes beside account counts and pricing inputs. If a number came from a CRM export, data provider, customer interview or finance system, record that origin in the same row.
For each segment, include columns for:
- Account count
- Annual revenue per account
- Serviceability proportion
- Reachable account count
- Capture assumption
- Implied SOM
- Confidence level
- Owner and review date
Show low, base and high cases side by side. The cases don't need false precision. Their purpose is to show which assumptions can change the decision. If the recommendation changes whenever annual value moves slightly, the team needs better pricing evidence before committing to outbound investment.
A ROI calculator can help frame the commercial return alongside the market estimate, but it shouldn't replace the underlying account and capacity model. Market size tells you how much opportunity may exist. ROI analysis tests whether pursuing it justifies the required cost and effort.
Keep the workbook alive
Assign one owner. Add a review date to every material assumption. Version the file when the ICP, pricing, geography or sales capacity changes. Review the model with sales after campaigns produce real objections and with finance when actual contract values diverge from the plan.
A spreadsheet becomes a vanity number when nobody updates the account universe or records why an assumption changed. Treat it as a living operating document, not a one-time exercise.
Using the Result to Output a Better GTM Decision
The final question isn't “how large is the market?” It's what should the team do next?
Use the result to decide whether outbound deserves serious investment, which segment receives the first campaign and how much pipeline the current team can plausibly create. Keep a confidence band around the result. Revisit the same model quarterly as account coverage, pricing, competitive conditions, buying signals and sales capacity change.
A strong go-to-market strategy for B2B should connect the market model to campaign sequencing, ownership and measurement. If the SAM produces more qualified accounts than the team can work, prioritise. If the SOM depends on a capture rate the team can't support, revise it before setting targets.
The practical principle is simple: a market size is useful only when it changes what the sales team does next week.
H2 helps B2B technology and service companies turn market assumptions into workable outbound systems, from account research and qualification to enrichment, campaign execution and sales feedback loops. Visit H2 to explore a free GTM strategy and book a 15-minute introductory call about your audience, capacity and next commercial decision.
